
joint (FW geometry).
the weld bead.
Surface stress close to the weld bead of plates in cross joints
I initiated this research with Prof. Bruno Atzori, director of the Fatigue Team at the University of Padua.
The results have been successively refined and expanded by the Fatigue Team. |
|
| |
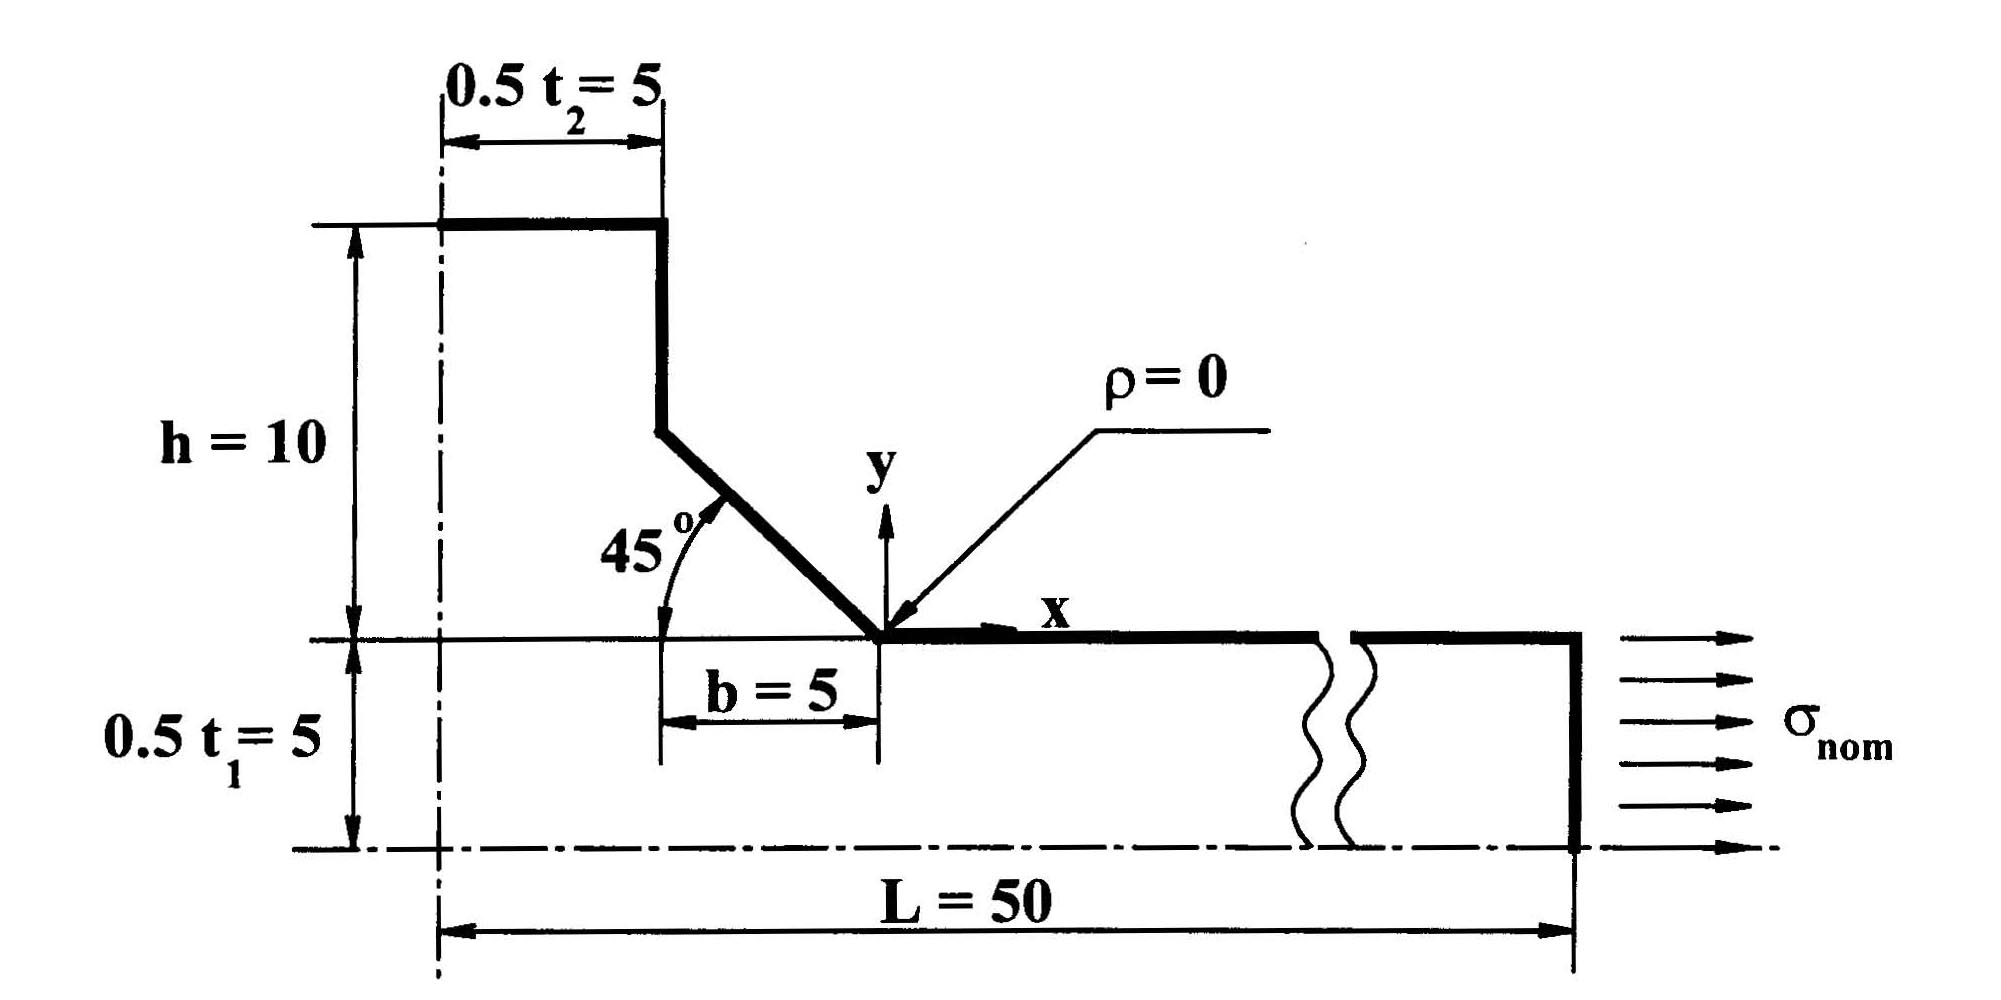
| Figure 1: Geometry of one fourth of the cross joint (FW geometry). |
Figure 2: FEM mesh of the cross joint close to the weld bead. |
In the first model the local stress field corresponds to that of a butt-weld joint, whereas in the second model it is that of a sharply notched joint.
The geometries of these components are defined from that of the actual cross joint.
The first model is more suitable for practical applications, since it is derived from the common definition of "hot-spot" stress, whereas the second model is more useful from a methodological point of view.
|
In model 1 the surface stress is considered to be the combination of the structural stress of a cross joint with fillet bounded by the weld bead, Fig. 3, and the local stress of a butt-weld joint, Fig. 4. |
 |
 | |
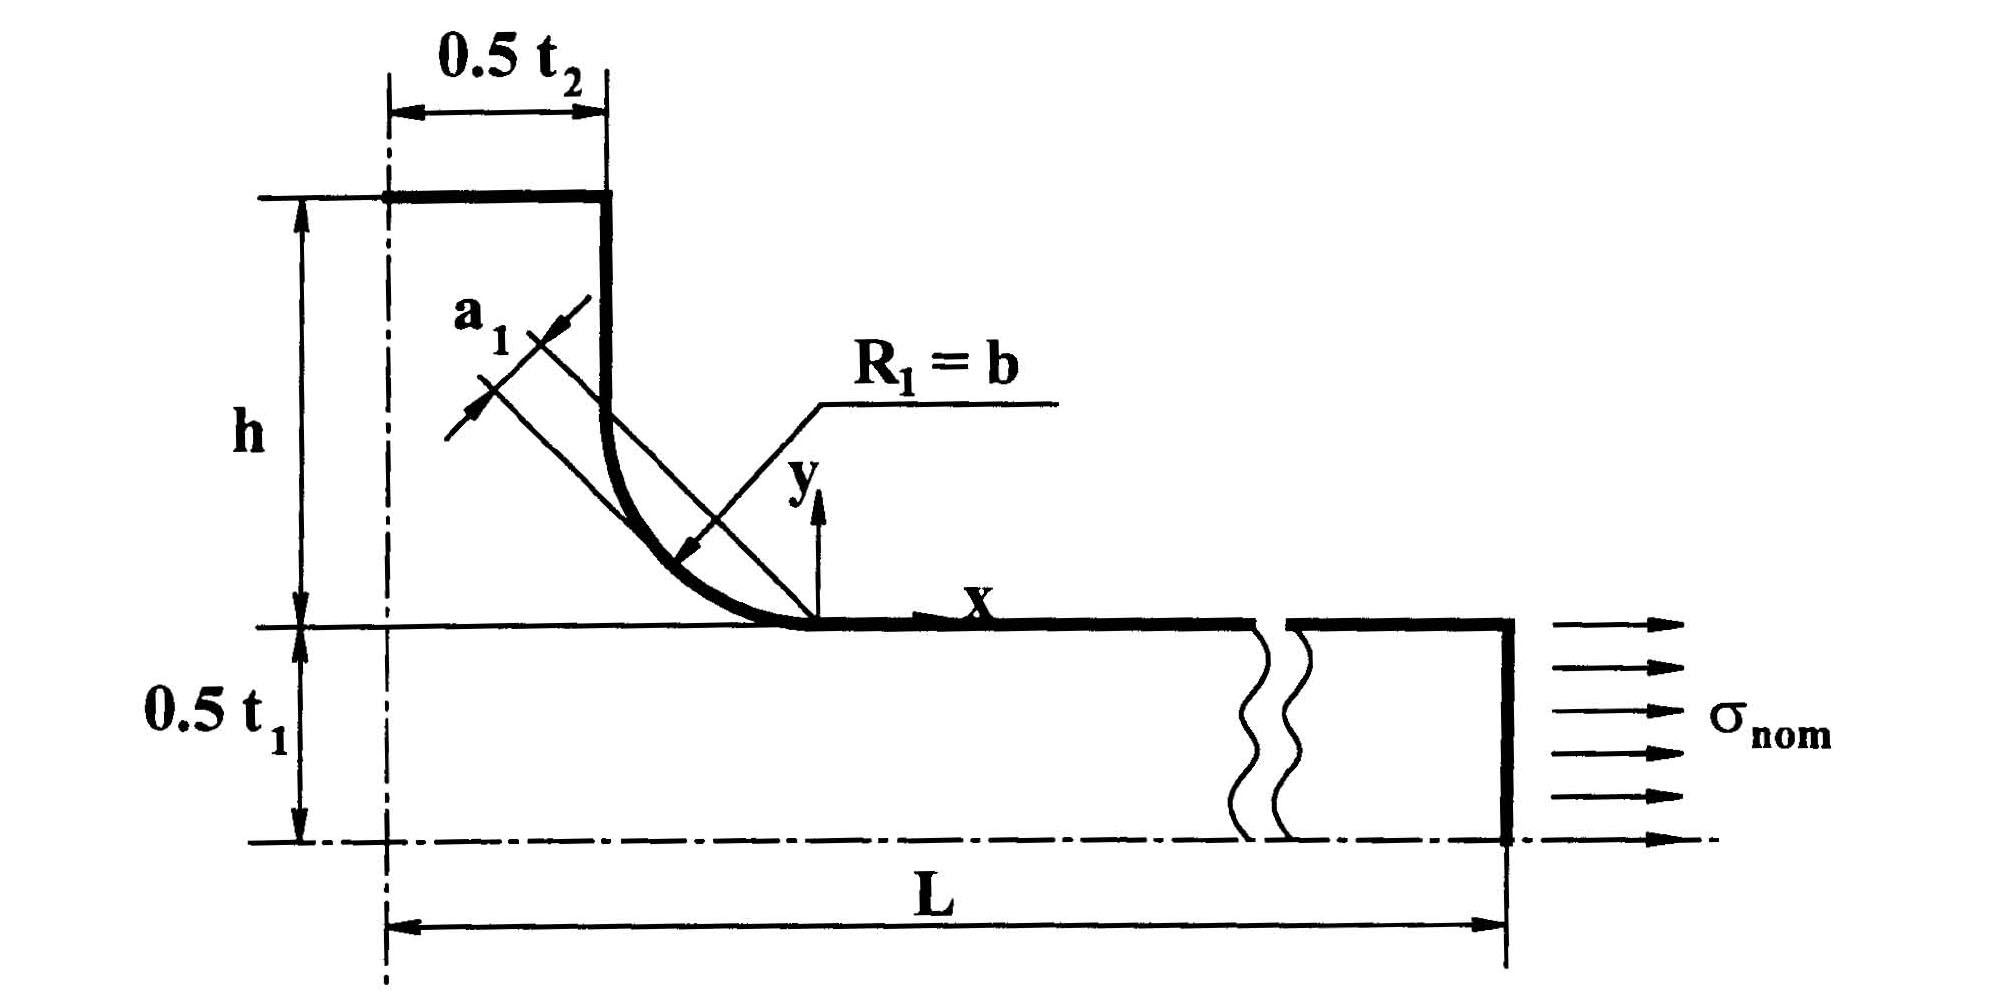
| Figure 3: Geometry of one fourth of the cross joint with fillet bounded by the weld bead (C1 geometry). |
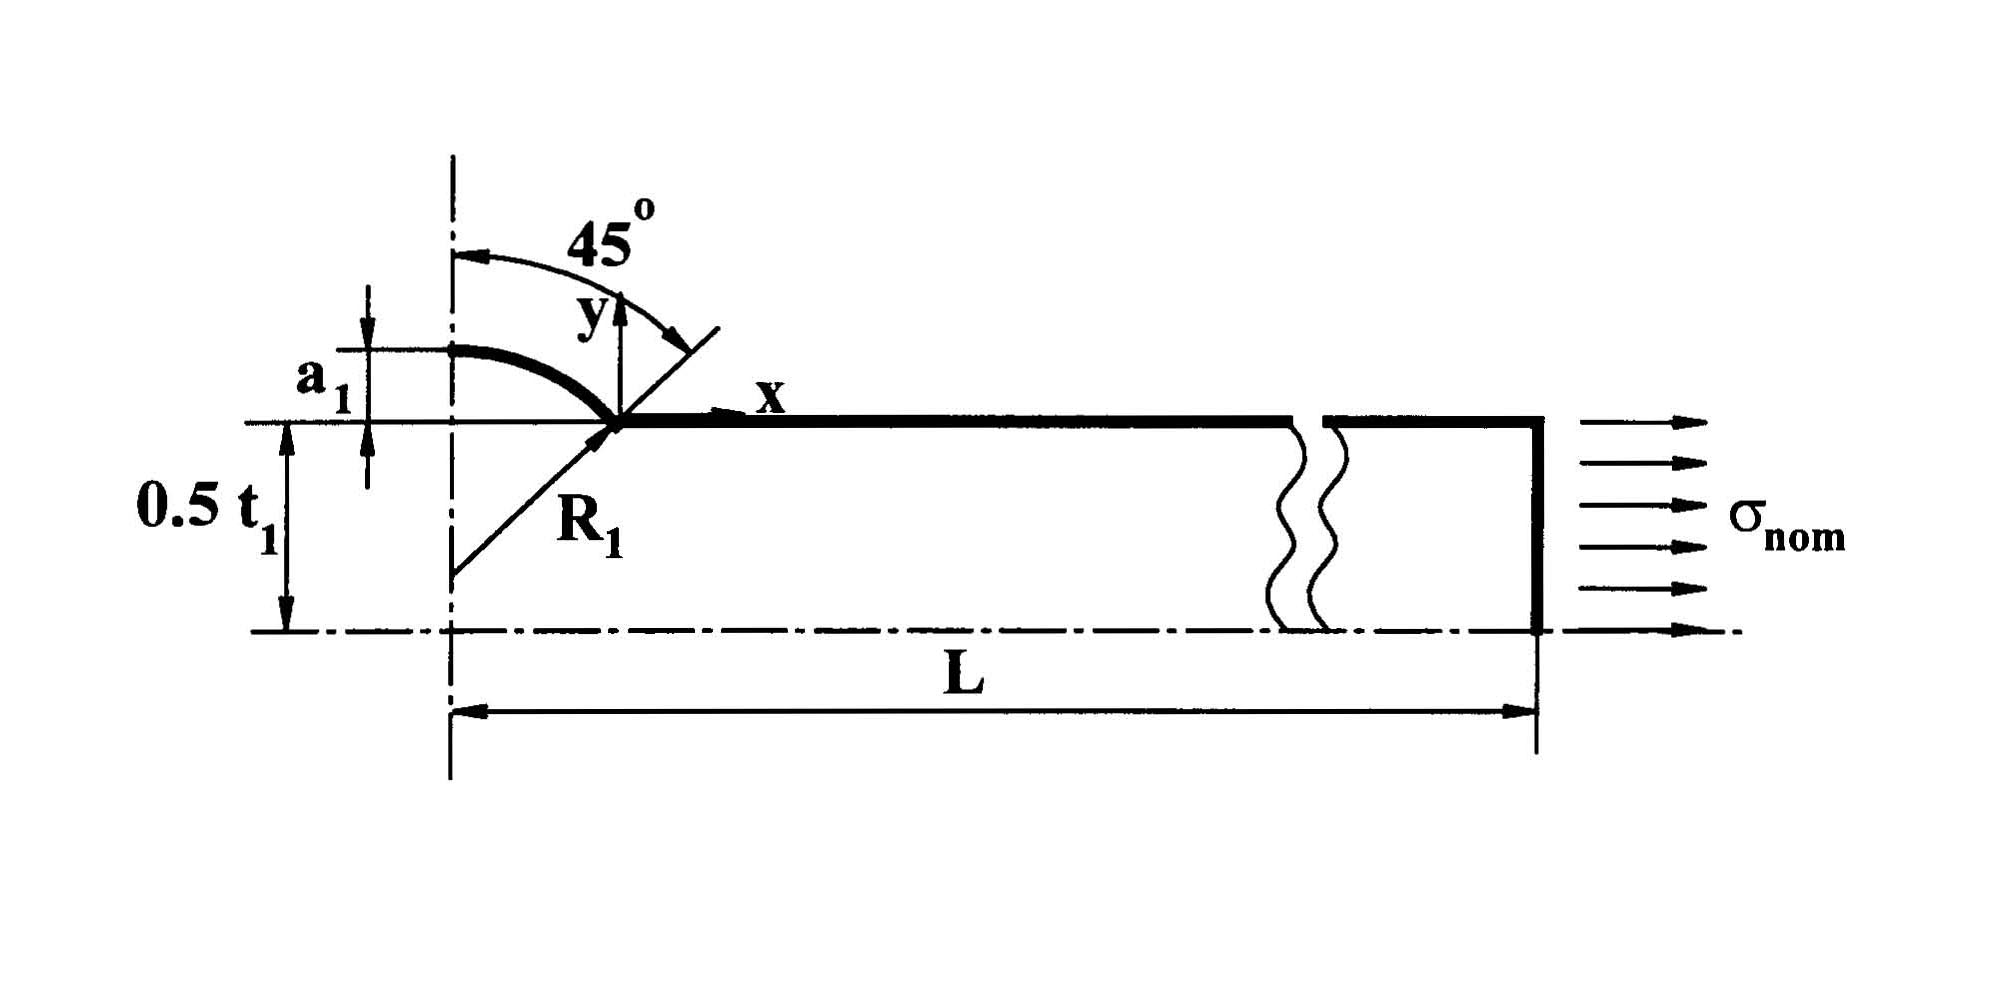
Figure 4: Geometry of one fourth of the butt-weld joint (BW geometry). |
Figure 5 shows the normalized (by the nominal value) surface stress distribution for the actual cross joint FW, the joint with fillet (C1), the butt-weld joint (BW), and the combination of the last two (C1*BW). |
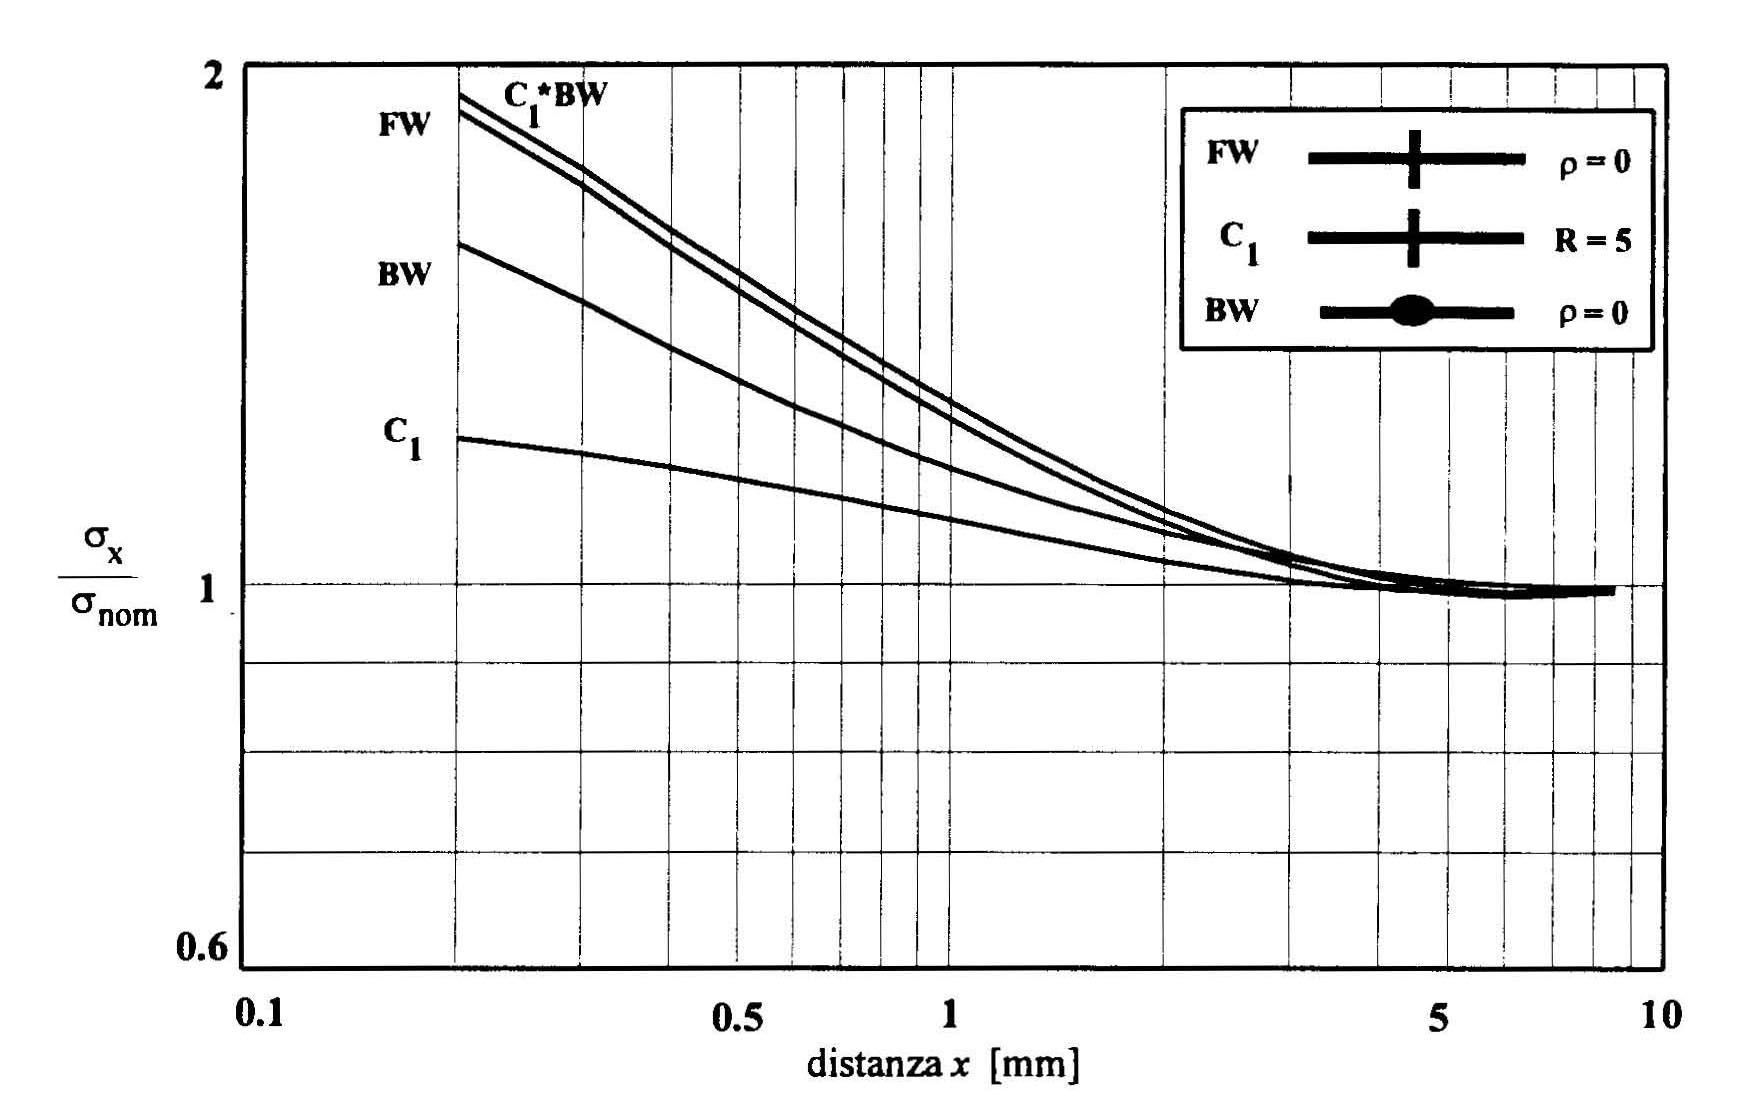 |
| Figure 5: Normalized surface stress distribution for the actual cross joint (FW) and the geometries of model 1 (C1 and BW). |
The results support the hypotheses of model 1 since the combined structural and local stress fields from the model closely match that of the actual cross joint.
|
 |
 | |
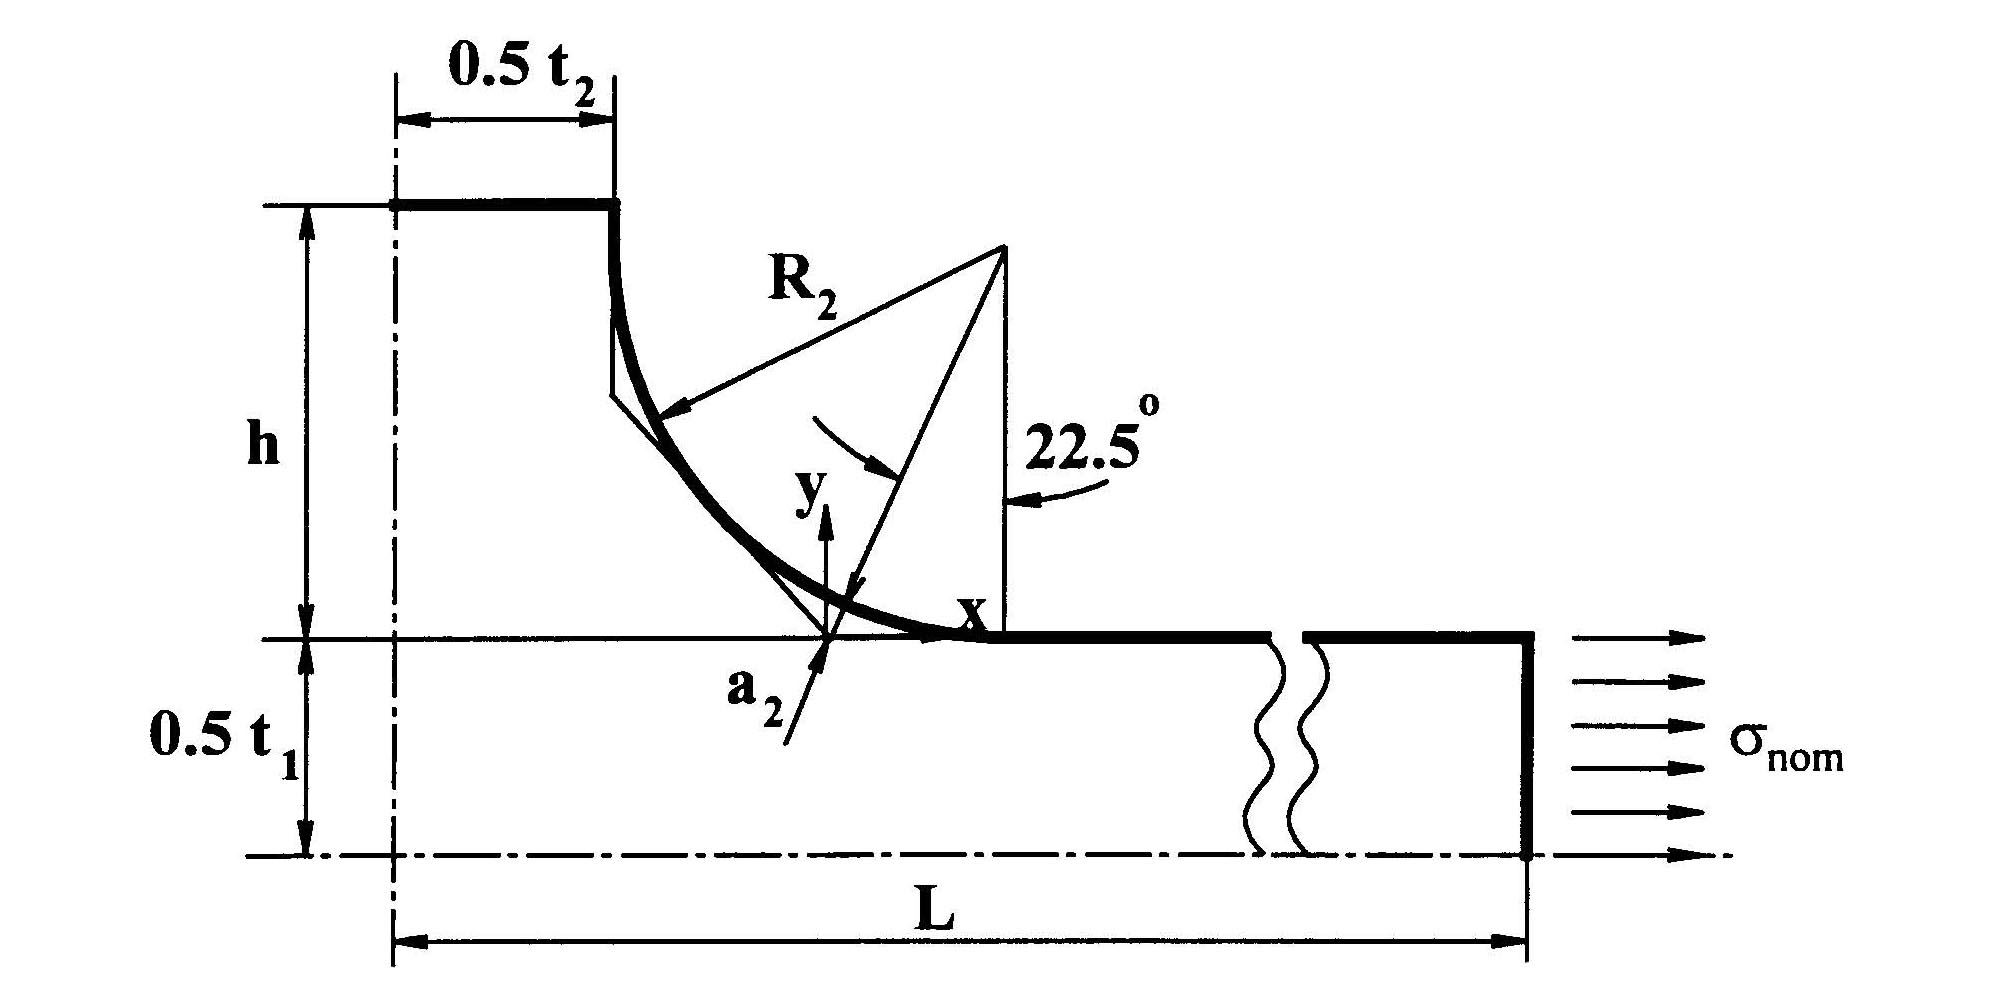
| Figure 6: Geometry of one fourth of the cross joint with radius bounding the weld bead (C2 geometry). |
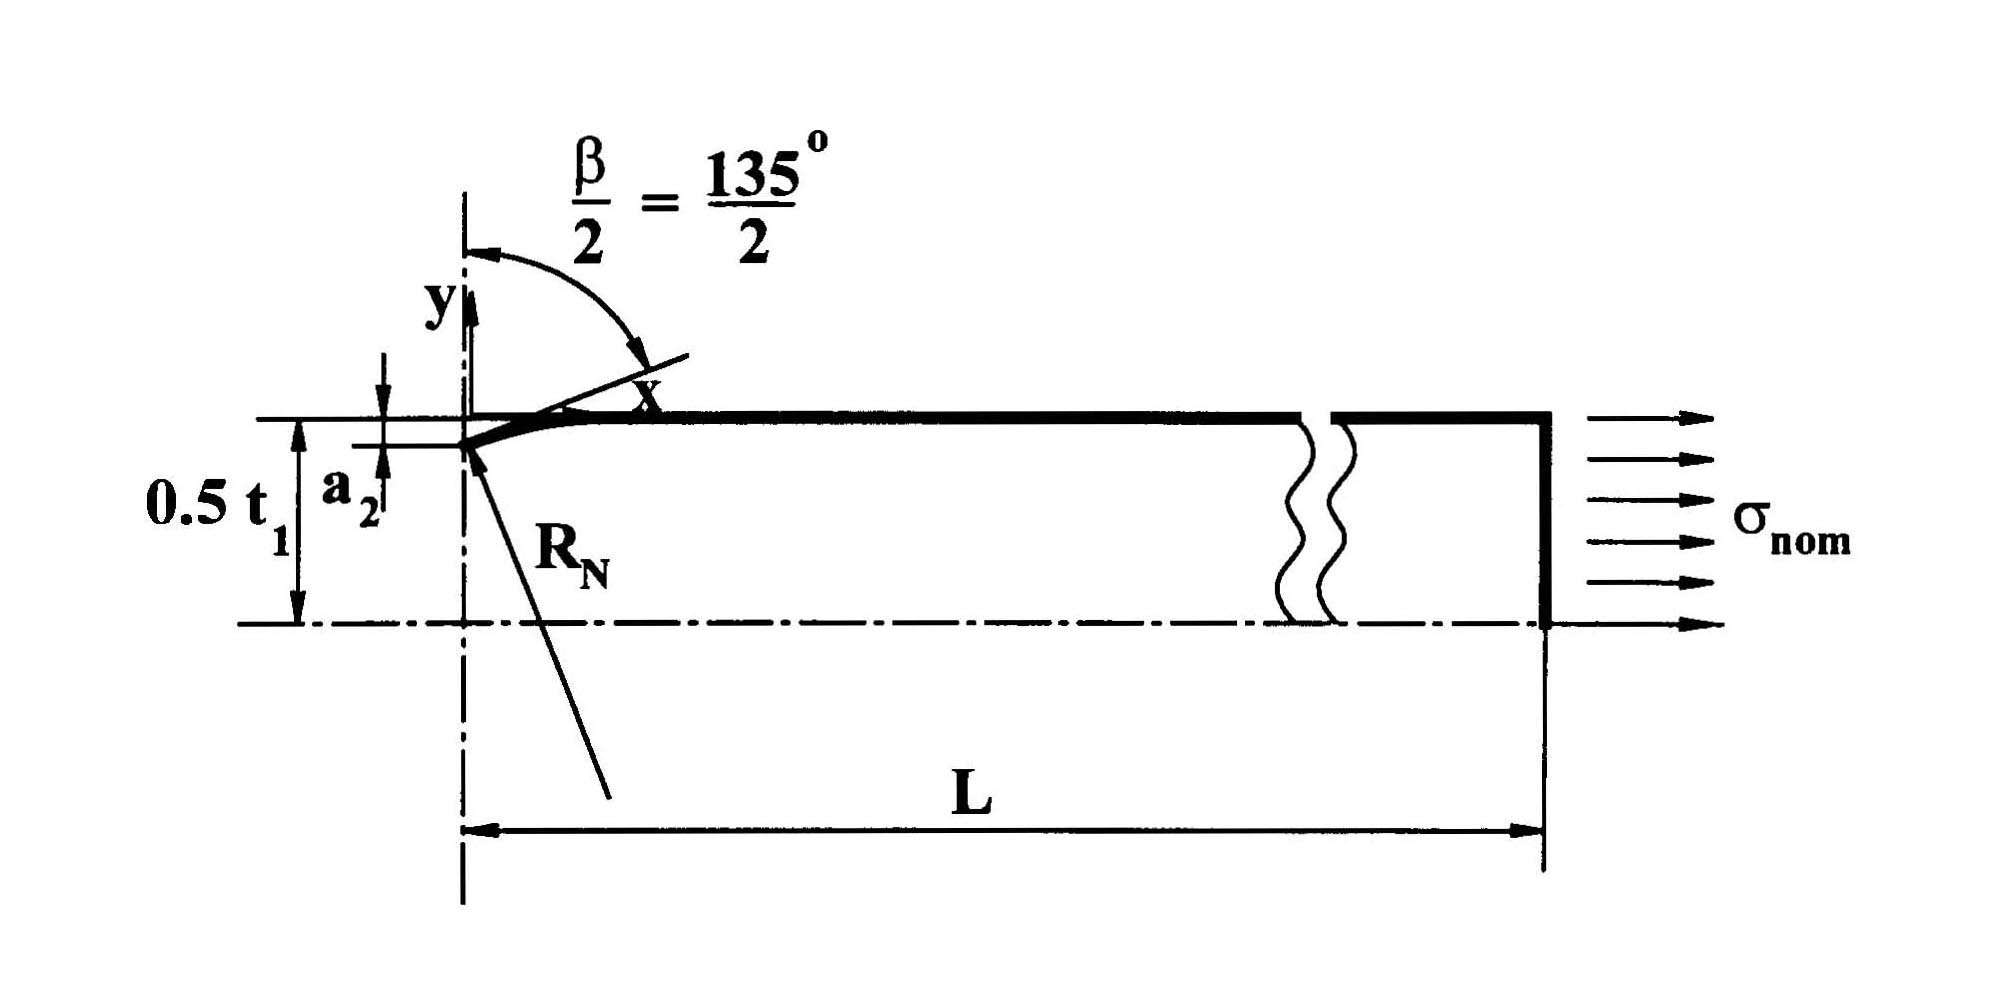
Figure 7: Geometry of one fourth of the sharply notched joint (SN geometry). |
Figure 8 compares the normalized surface stress distributions of the geometries of model 2 with that of the original cross joint. Again the results validate the model since the combined structural and local stress fields from the model closely match that of the actual cross joint. |
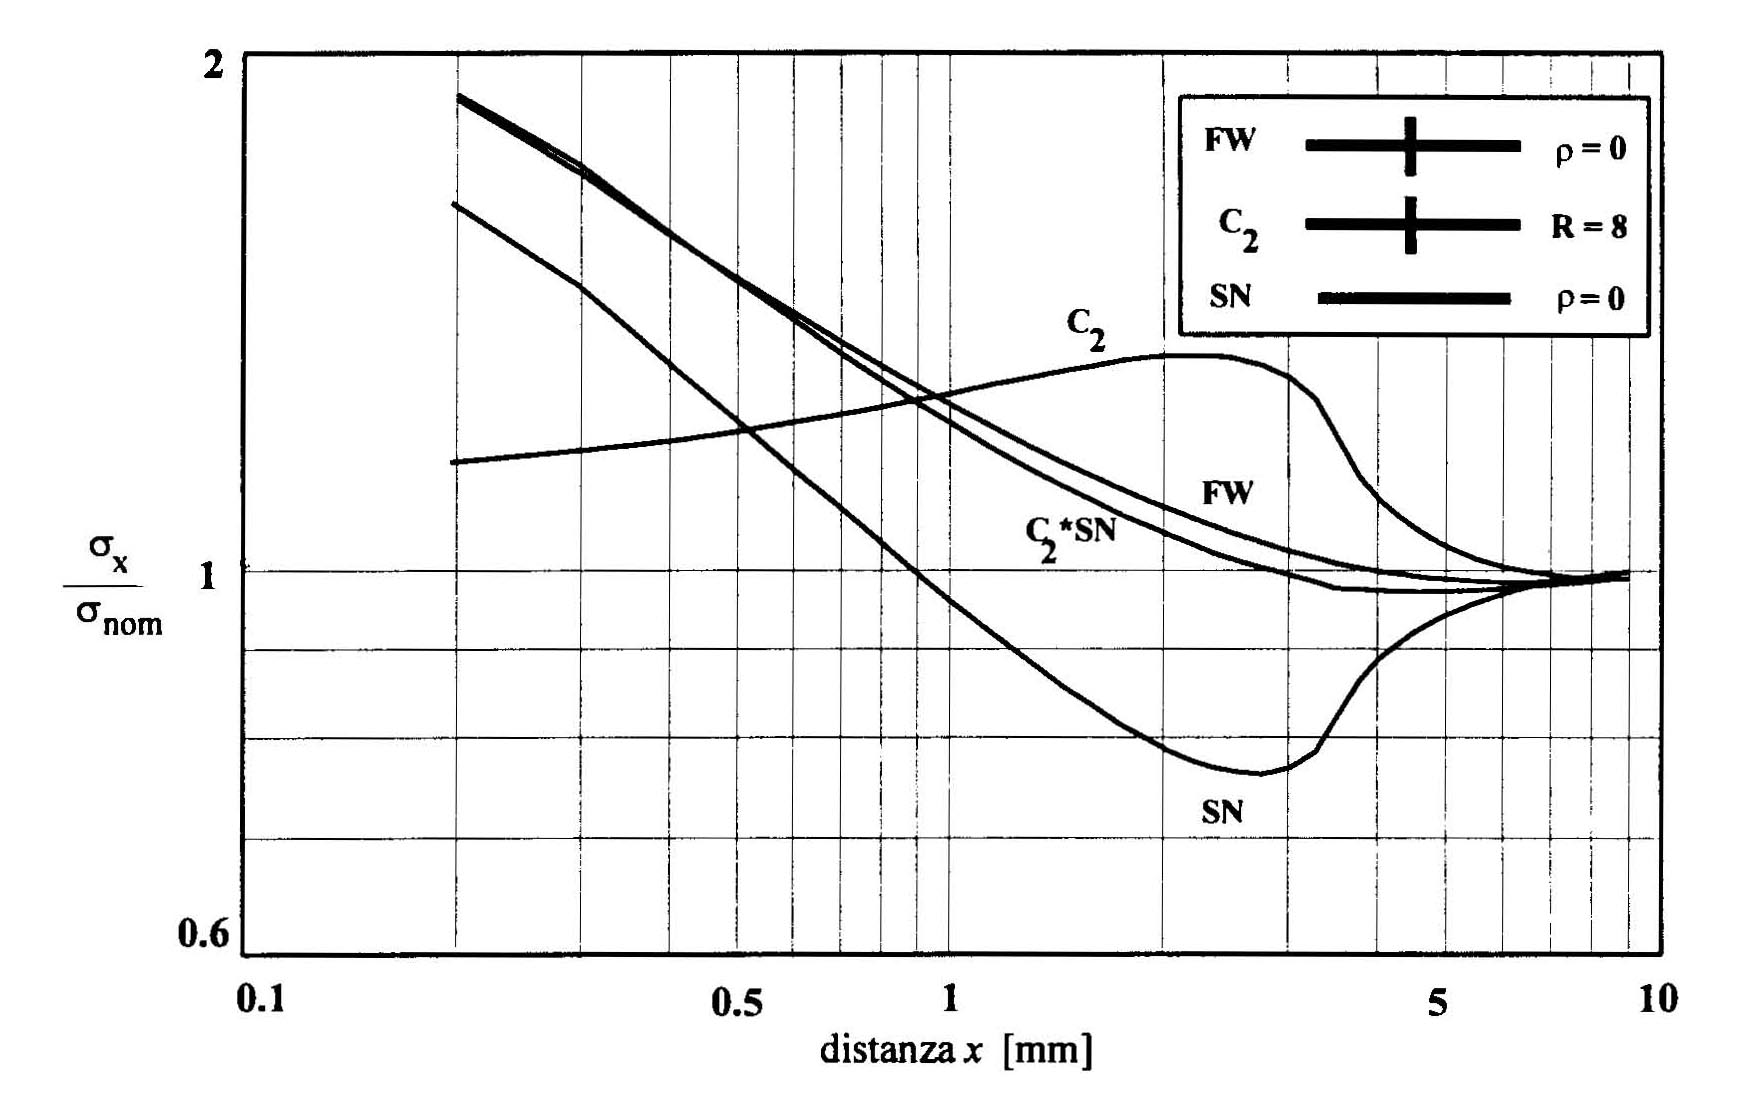 |
| Figure 8: Normalized surface stress distribution for the actual cross joint (FW) and the geometries of model 2 (C2 and SN). |
| MD previous research | MD research | MD home |